The Role of Data Visualization in Predictive Analytics for Marketing
Businesses have long sought to gain deep insights into future trends to drive their marketing strategies. Predictive analytics has transformed how companies can forecast customer behaviors and needs. This change has come, in large part, from advancements in AI and machine learning. These technologies enable companies to create targeted, data-driven marketing campaigns.
Data visualization plays a crucial role in predictive analytics. It interprets complex data sets and conveys key trends and patterns in easily understood formats. This integration has unlocked transformative opportunities for more precise and impactful marketing.
Advancements in Predictive Analytics for Digital Marketing Campaigns
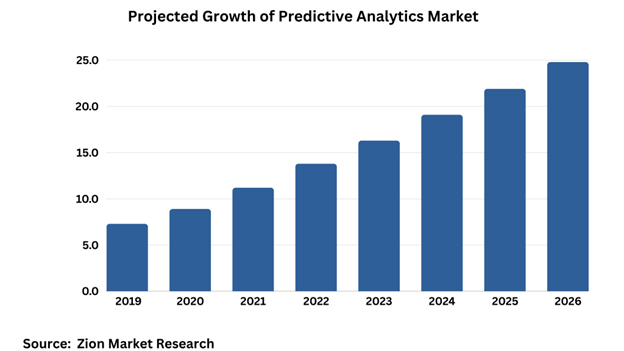
Predictive analytics in digital marketing has come a long way. With advanced modeling and tons of customer data, we’re now predicting behaviors like never before. By 2026, the market for predictive analytics is expected to reach a whopping $27 billion! This substantial increase demonstrates our improving ability to utilize data for marketing purposes.
Artificial Intelligence (AI) and Machine Learning (ML) are key players here. They help us analyze huge amounts of data faster and more accurately than ever. This means we can understand customer behaviors in more detail, and at a much faster pace.
Why does all this matter? Well, it’s not just about fancy tech lingo. It’s about the bottom line. Firms using these sophisticated predictive analytics are raking in an extra £85 billion in revenue every year! That’s a huge advantage over competitors who aren’t tapping into this technology. So, accurate predictions about customer behavior aren’t just cool—they’re game-changers for businesses.
Transformative Impact of Data Visualization on Marketing Decisions
Predictive analytics offers invaluable forecasting of trends. Translating this complex data into intuitive formats for decision-making is important. Data visualizations for marketers are crucial for making sense of complex data in marketing decisions. It takes predictive analytics and turns it into easy-to-understand visuals like charts and graphs. This helps marketers see trends quickly and make better strategies.
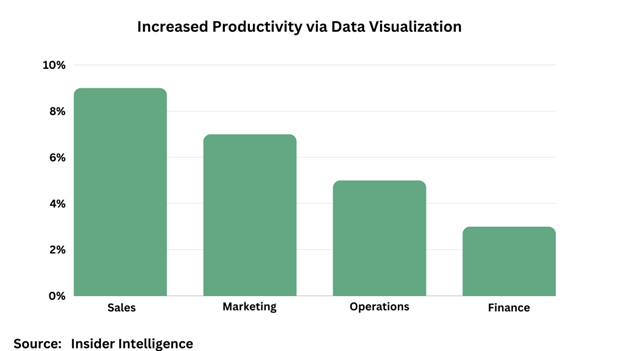
Nearly 60% of marketers emphasize the importance of easily comprehensible data for making informed decisions. When predictive analytics is combined with clear visualization, it makes marketing efforts better. Companies that use data visualization in decision-making tend to have 8% higher sales productivity.
Here’s how data visualization aids marketers:
- It helps identify different customer groups with unique behaviors and preferences. This makes it easier to engage them effectively. For example, financial services saw a 23% increase in campaign response rates using this approach.
- Marketers can strategically time messages and campaigns. They can do this based on predictive models which suggest higher engagement. This can boost open rates significantly.
- Personalizing content based on predicted preferences can lead to higher conversion rates. Using AI to match content to audience preferences can increase conversion rates by 2.5 times.
- Marketers can achieve better returns on investment. They can do this by continually optimizing resources based on predictive models. This approach leads to 27% greater returns compared to traditional budgeting methods.
Integrating AI and Machine Learning into Marketing Analytics:
Predictive analytics is seeing a whopping 23.2% growth every year. This rapid growth is mainly because of how AI and machine learning (ML) are deeply ingrained in its core.
These technologies help in automating the creation and fine-tuning of complex statistical models. They’re crucial for analyzing the ever-growing amounts of data that come in various forms and at high speeds. Machine learning algorithms and neural networks are unlocking predictions about human behavior. These predictions were unimaginable before.
Without the integration of AI and ML, modern predictive analytics wouldn’t be nearly as powerful as it is today.
Strategies for Implementing Predictive Analytics in Marketing Campaigns
Here’s how to effectively use predictive analytics in your marketing campaigns:
- Segmentation: Identify and understand different customer groups based on predicted behaviors. This helps in targeting specific initiatives. For instance, using predictive lead scoring can increase qualified conversion rates by 41%. For example, Calvin Klein boosted email campaign conversions by 15%. They also increased average order value by 14% through AI-driven predictive customer segmentation.
- Campaign Personalization: Customize your messaging, content, and timing for each segment’s interests. These interests are predicted by predictive models.
- Resource Optimization: Invest your marketing resources wisely. Focus on tactics that give the best return on investment (ROI). Continuous optimization helps avoid spending on low-performing initiatives.
Best Practices for Data Visualization in Marketing Analytics
Here are some key tips for making your data visualizations in marketing analytics more effective:
1. Keep it Clear and Simple
Arrange your visuals in an easy-to-understand way, using colors, shapes, and positioning that make sense. Make good use of empty space, align elements neatly, and layer information thoughtfully. Choose fonts and typography that are easy to read.
2. Provide Context
Use labels, callouts, and captions to explain what the data means. Include annotations and terminology that help clarify concepts, and add reference points to make it easier to see trends.
3. Highlight Important Relationships
Use contrasting colors and sizes. This will draw attention to significant correlations. Make outliers and exceptions stand out visually. Consider using overlay charts to compare different sets of data.
4. Tell a Focused Story
Guide your audience’s attention to the most important insights. Organize your visualizations in a logical sequence that tells a clear story. Use summary graphics to reinforce your main conclusions.
Follow these best practices. You can transform complicated data into valuable insights. These insights drive successful marketing strategies.
Future Trends in Predictive Analytics: The Evolving Landscape of Predictive Analytics in Marketing
Advancements in AI and machine learning, along with the explosion of data, will lead to even better predictive analytics in the future.
Techniques such as deep learning and neural networks will unveil intricate behavioral insights. This will improve marketing strategies. Cloud-based analytics makes it easier for many businesses to use these tools. This is achieved by reducing infrastructure barriers. Predictive analytics is driving significant changes across companies, reflecting its promising future.
Conclusion
Predictive analytics and data visualization are becoming increasingly vital in marketing. Combining them offers immense value. Using AI and ML for predictive modeling across different sectors provides transformative opportunities. Clear data visualization is also part of this process. It helps anticipate market trends and develop effective marketing strategies that outshine competitors.
To stay ahead in the game, marketing leaders need to keep an eye on emerging trends in predictive analytics and data visualization. These tools offer deeper insights into consumer behavior, enabling sharper strategies. Looking forward, predictive analytics is set to become even more influential. It will become a central component of modern marketing strategies.
FAQs
1. Why is the integration of predictive analytics and data visualization important in marketing?
AI and machine learning are the driving forces behind predictive analytics. It helps businesses forecast customer behaviors and needs for targeted marketing. Data visualization is a crucial link. It interprets complex data into easily understood formats. This integration unlocks transformative opportunities for precise and impactful marketing strategies.
2. What is the role of AI and machine learning in marketing
AI and machine learning analyze vast amounts of data quickly and accurately. This enables detailed insights into customer behaviors. Technological advancement aids in predicting trends and behaviors. It provides businesses with a competitive edge. Companies utilizing these sophisticated predictive analytics gain significant revenue advantages over competitors.
3. What are the benefits of using data visualization in marketing decision-making?
Data visualization simplifies complex data. It makes it easier for marketers to identify trends and make informed decisions. It helps in targeting specific customer groups, timing campaigns strategically, and personalizing content. This leads to higher conversion rates. Additionally, companies that use data visualization tend to experience higher sales productivity. They also experience better returns on investment.